How to Track Design Metrics
Jan 1, 2024
Company
Roles
Industry
Duration
"Design is not just what it looks like and feels like. Design is how it works." – Steve Jobs
We all know that great design can elevate a product or service from good to exceptional. But in today's data-driven world, how do we actually prove that our design is making that impact? Design metrics are the answer. Think of them as the X-ray that lets you see how well the skeleton of your product is supporting its success.
Why Bother with Design Metrics?
Let's be real, digging into metrics might not feel as exciting for most designers as crafting the perfect visual hierarchy. But here's why it matters:
Justify Design Decisions: Instead of relying on subjective arguments like "this looks better," designers can present data on how the design impacts user behavior or business outcomes. For example, "Implementing this new call-to-action button increased sign-ups by 15%." Metrics can be likened to a designer's lightsaber. Just as a lightsaber is a Jedi's tool for defense and offense, metrics serve as a designer's tool for validating and advocating design decisions.

Uncover Problems Early: Tracking design metrics is like having an early warning system for potential user experience hiccups. Metrics like task success rate or error rate allows you to identify friction points in the user experience. Maybe users consistently abandon a form at a specific field. This data empowers you to address issues proactively before they cause widespread frustration.

Fuel Your Growth Engine: Design metrics can reveal how design directly influences key business objectives. If you notice that a redesigned landing page has boosted conversion rates, you've validated the value of design investment. This also helps you identify areas where design changes can further drive business success.
Choosing Your Weapons: What Metrics to Track
Navigating the vast array of metrics can be daunting, but fear not! Think of this as assembling your own toolkit for understanding your design's performance. Start with the basics and gradually expand your arsenal as you gain experience. Here's a simplified breakdown of common categories:
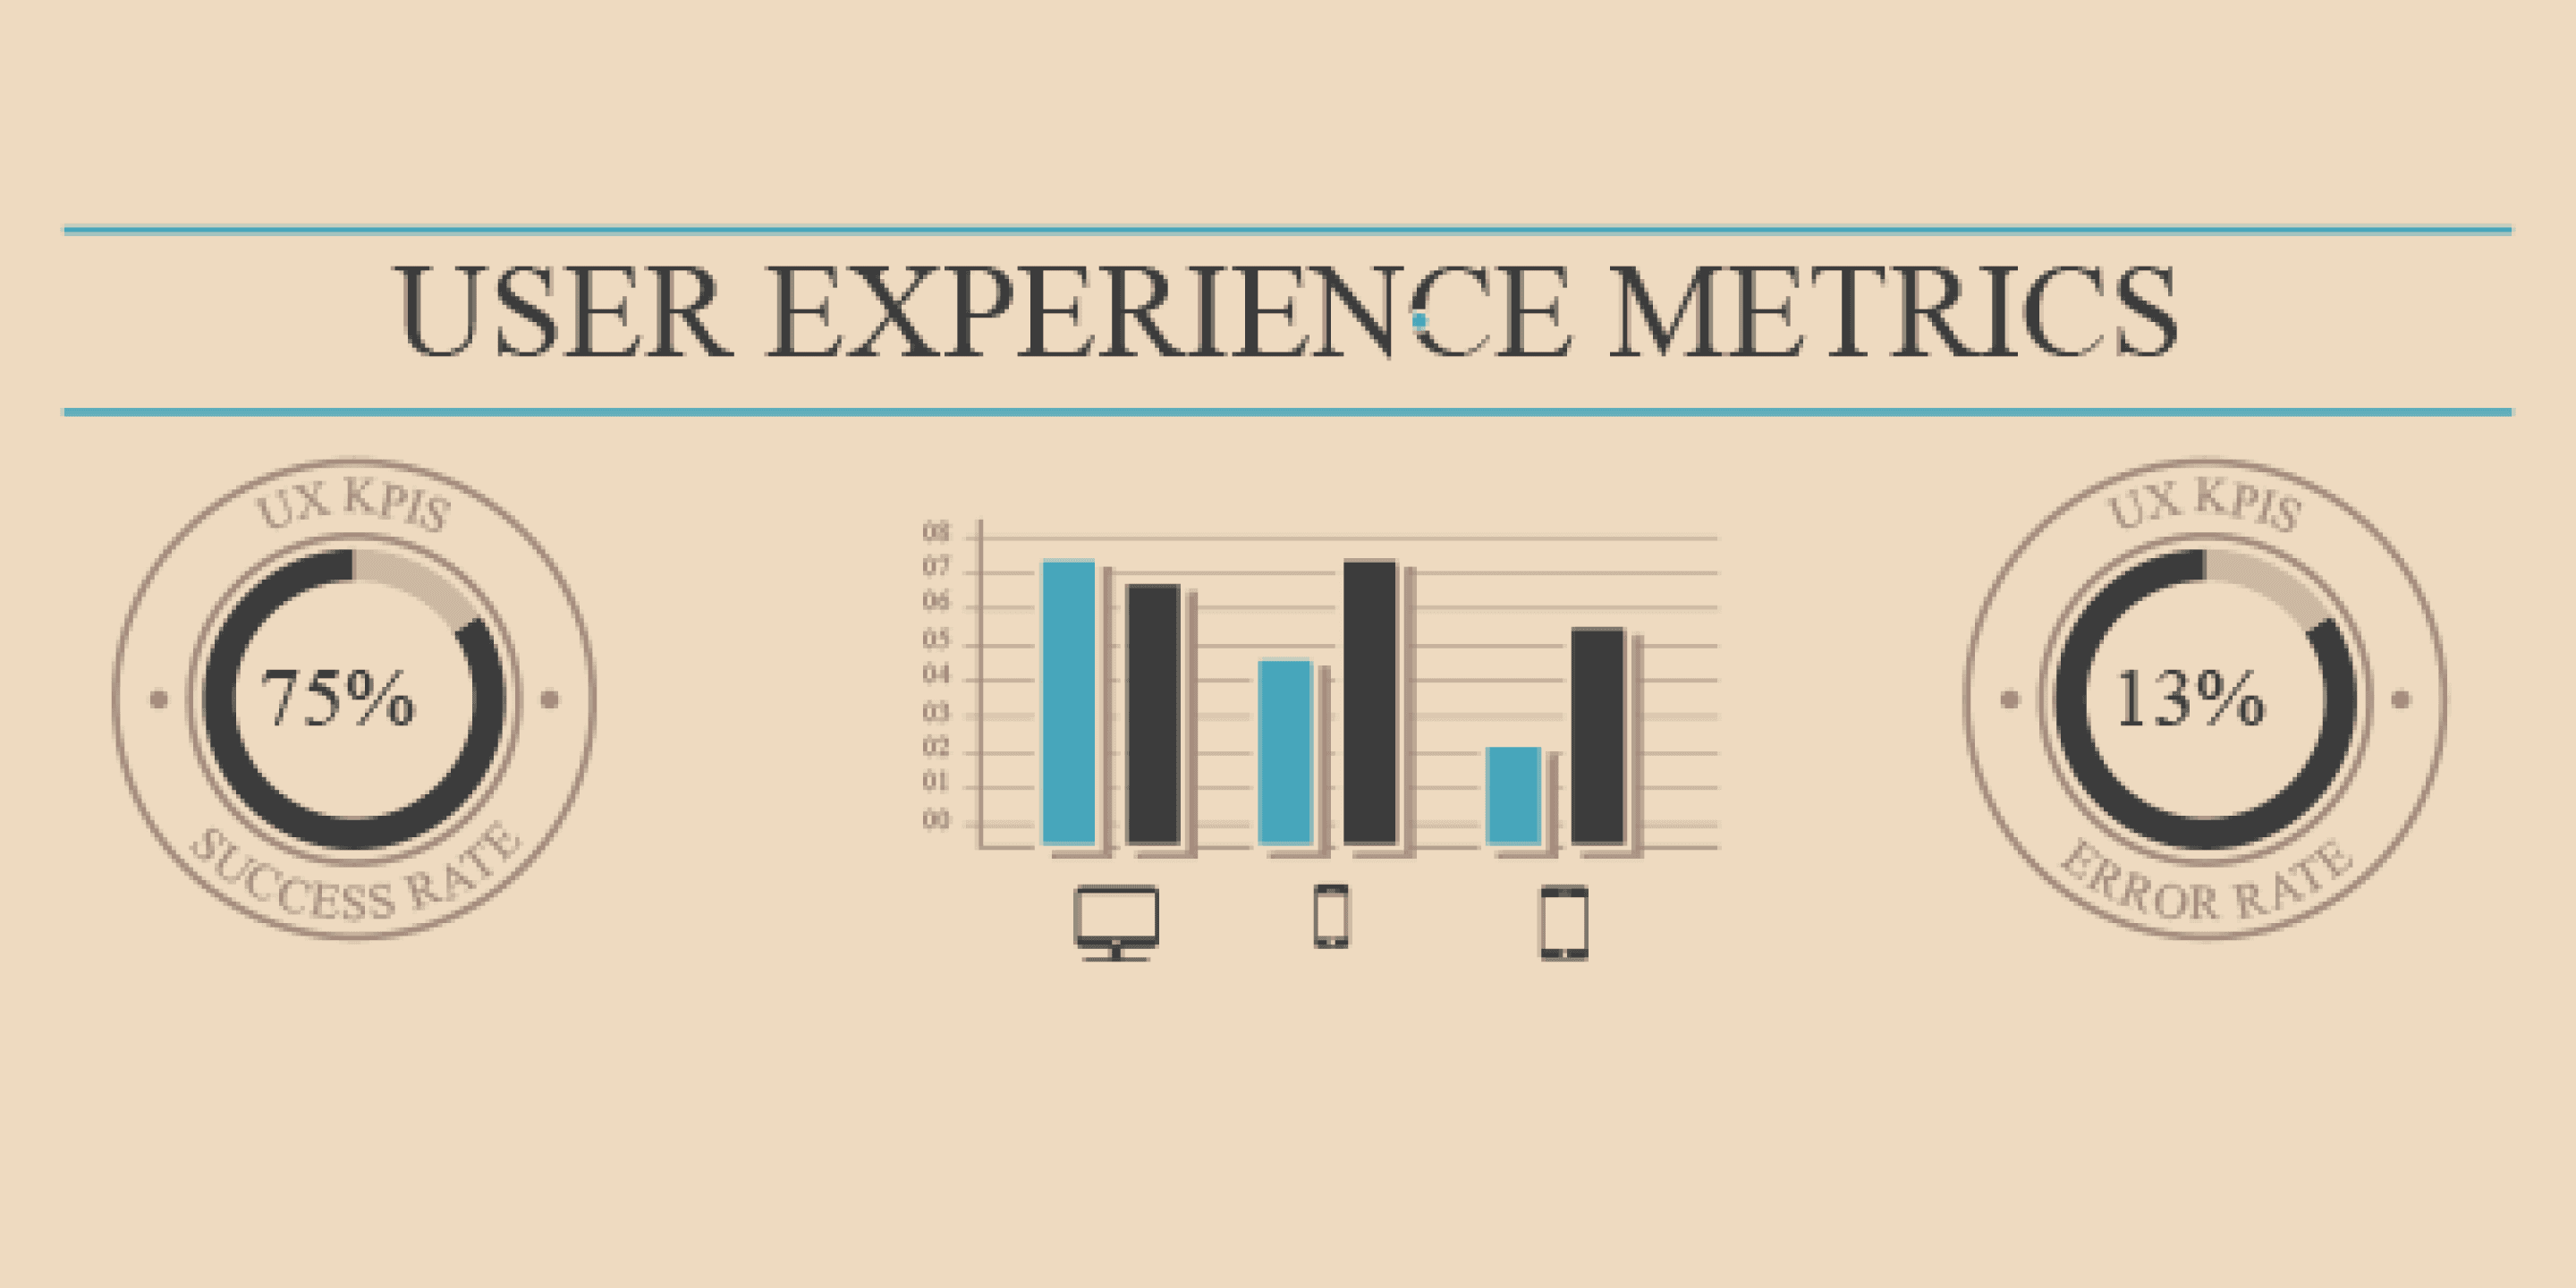
Usability Metrics:
Task Success Rate: How easily can users accomplish tasks?
Error Rate: How often do users encounter problems or obstacles?
Time on Task: Are your designs efficient, or do users spend too much time navigating?
User Satisfaction Metrics:
Net Promoter Score (NPS): How likely are users to recommend your product to others?
Customer Effort Score (CES): How easy or difficult is it for users to use your product?
Qualitative Feedback: What are users saying in open-ended survey responses? This provides deeper insights into their experiences and preferences.
Business Impact Metrics:
Conversion Rates: How successful is your design at turning visitors into customers or achieving desired actions?
Retention: Do users return to your product or website?
Revenue Tied to Design Changes: Can specific features or design improvements directly correlate with increased revenue or business success?
While these are not the ultimate rule or metrics to track, but by focusing on these fundamental metrics, you can better understand how your design decisions impact user experiences and business outcomes. As you continue to refine your approach, you can expand your analytics toolkit to include more advanced metrics and insights. Remember, it's all about starting with the essentials and building from there as you grow and learn.
Tracking Metrics Like a Pro
"The greatest value of a picture is when it forces us to notice what we never expected to see." – John Tukey (Statistician)
Setting Goals, Not Just Targets:
Instead of just aiming for numbers like increased sign-ups or reduced support calls, it's essential to understand the broader objectives behind these metrics. For instance, the goal might be to improve user engagement or enhance customer satisfaction. By aligning metrics with these real objectives, you gain a clearer understanding of the impact of your design decisions.
Mix and Match:
Don't rely solely on one type of metric. Quantitative data provides numerical insights, such as the number of sign-ups or clicks. On the other hand, qualitative data delves into the emotions and experiences of users, offering deeper insights into why certain behaviors occur. By combining both types of data, you get a more comprehensive view of how users interact with your design and what improvements can be made.
Keep Improving
Just Like Your Designs. Just as you continuously iterate and refine your designs based on feedback and testing, the same approach should be applied to your metrics. Analyze the results you gather, identify areas for improvement, and make adjustments to your metrics strategy accordingly. As your product evolves and matures, so too should your understanding of which metrics are most relevant and meaningful to track
This iterative process ensures that your metrics remain aligned with the evolving goals and objectives of your design projects. By continuously refining your approach to metrics, you can better gauge the effectiveness of your design decisions and drive ongoing improvement in user experiences.
Tools of the Trade
Analytics Tools: Just like Google Maps helps you navigate, tools like Google Analytics or Mixpanel can show you where people click, how long they stay, and lots more. Depending on what you need, I can suggest even more tools that might be a perfect fit for you.
A/B Testing Platforms: They let you create different versions of your website or app and then show them to different people. Tools like Optimizely or VWO can help you figure out which version works the best and makes people happier.
Usability Testing Software: It's like having a secret camera watching people as they click around and explore. With tools like UserTesting.com or Hotjar, you can watch real people interact with your designs and understand where they might be getting stuck or confused.
Design Metrics Spark Conversations
Data isn't about proving who's right or wrong. Instead, it's a way to kickstart discussions about how design can make both users and the business happy. By understanding these metrics, you'll become a real champion for design.